Problem1 - b
Consider the case when \(H=W\) (a square cavity). Here, the Reynolds number, \(Re=UW/\nu\), characterizes the flow patters. Compute the steady state solutions for both \(Re=100\) and \(Re=500\). Plot the flow streamlines and centerline profiles (\(u\) vs. \(y\) and \(v\) vs. \(x\) through the center of the domain). For \(Re=100\), valdiate your method by comparing your results to data from given literature.
Re = 100
In this test, the lid cavity’s velocity is set to make the Reynolds number set to 100. To see the qualitative effect of different grid spacing, four different grid resolution conditions is employed and compared together in this page.
- NxN = 20x20
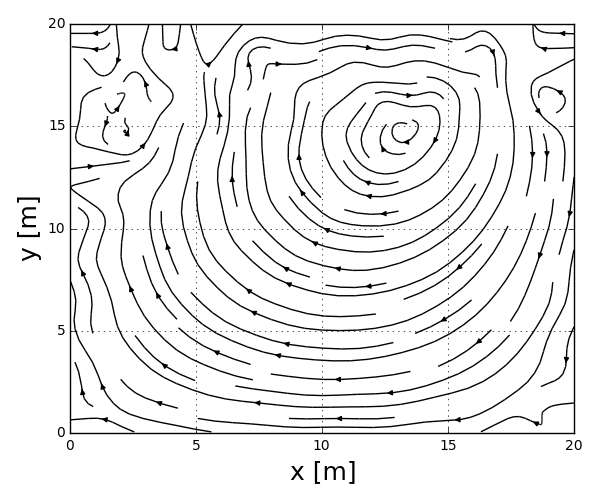
<Streamlines of 20x20 case runs>

<Centerline u-velocity compared with Ghia’s numerically resolved data>
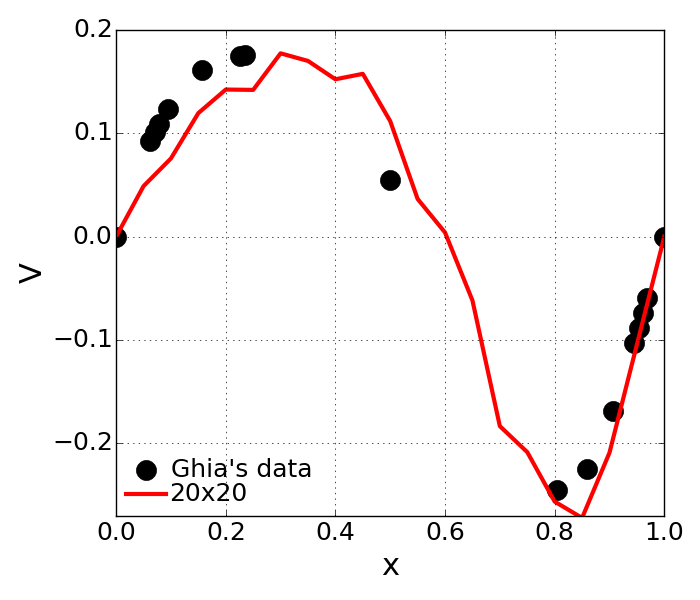
<Centerline v-velocity compared with Ghia’s numerically resolved data>
- Observation
- Coarser grid is horrible at achieving well-defined velocity field due to numerical errors and unstable solution.
- Despite this instability and error, the qualitative flow pattern is well resolved.
- The possible explanation of this inaccurate solution may be made with an arguement that particle streaming should be made across lattices closely apart each other.
- Far distance between neighboring lattices may not represent proper particle streaming process.
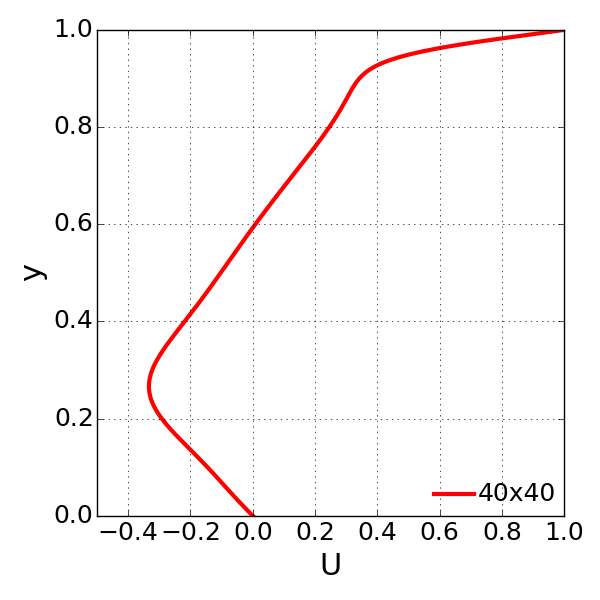
- NxN = 40x40
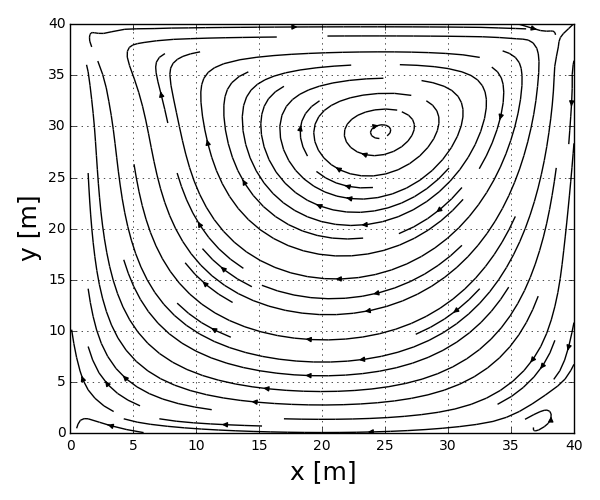
<Streamlines of 40x40 case runs>

<Centerline u-velocity compared with Ghia’s numerically resolved data>
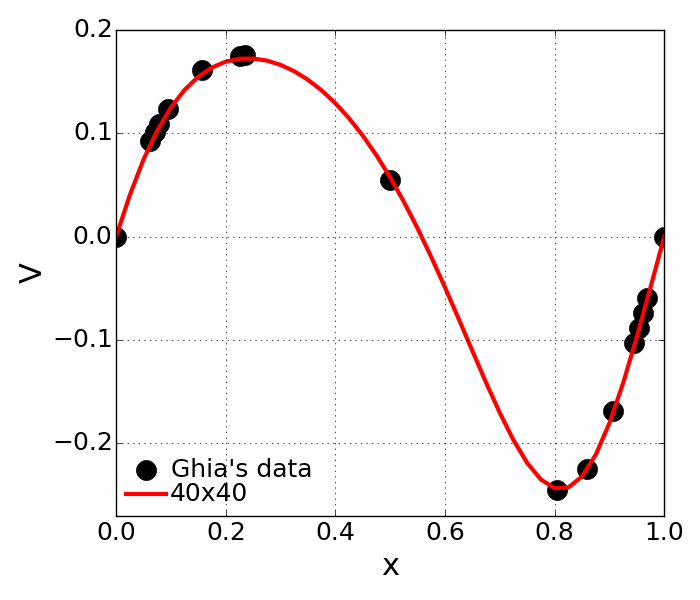
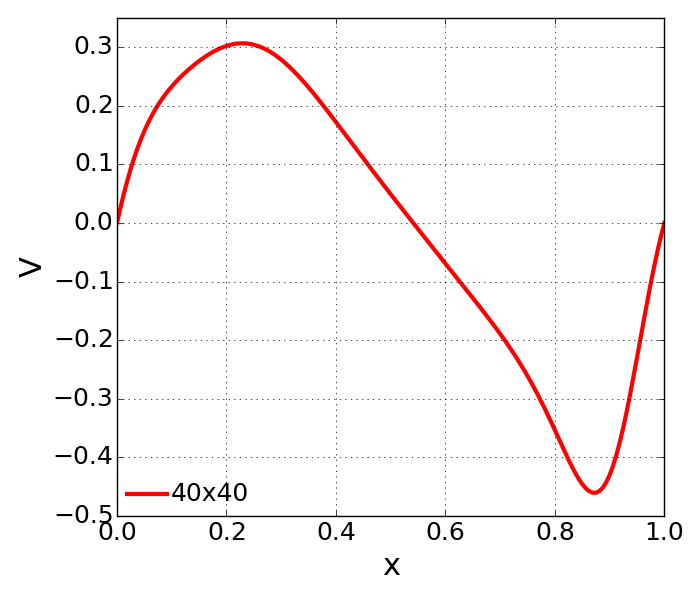
<Centerline v-velocity compared with Ghia’s numerically resolved data>
- Observation
- Grid resolution for this problem should be made up with 40x40 at least in order to have well-resolved flow properties with reasonable accuracy.
- The simulation data is in a good agreement with the reference data produced by Ghia et al.
- NxN = 80x80
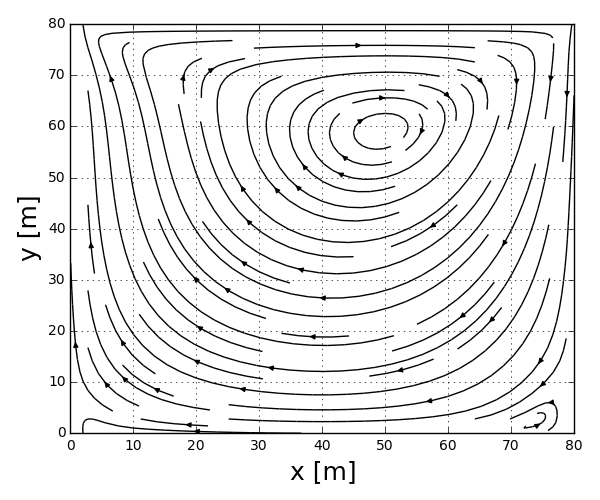
<Streamlines of 60x60 case runs>
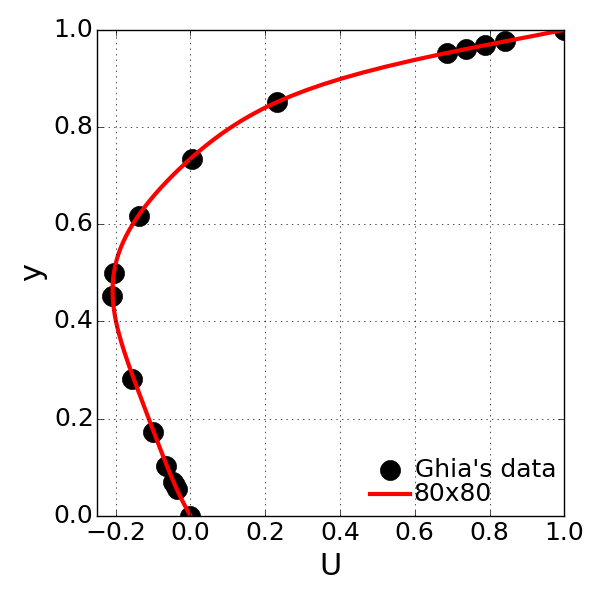
<Centerline u-velocity compared with Ghia’s numerically resolved data>

<Centerline v-velocity compared with Ghia’s numerically resolved data>
- Observation
- Having resolution of 80x80 makes finally the resolved data looks very close to the reference data.
- We observed the denser grid size produces the more well-matching data with reference data.
Re = 500
In this test, the lid cavity velocity is set to 50 m/s to make the Reynolds number 500. Here, only one single set of grid space was employed for effective simulation running, because this high Reynolds number case was stongly senstive to the grid resolution, so it was not successful with less grid points than this to have such that stable solution. Again, due to the computational time issue, having more than the current grid points were not effective either.
The chosen grid resolution is 160x160 in x and y directions. The computation time taken for this setup is 32151.1 sec.
- NxN = 160x160
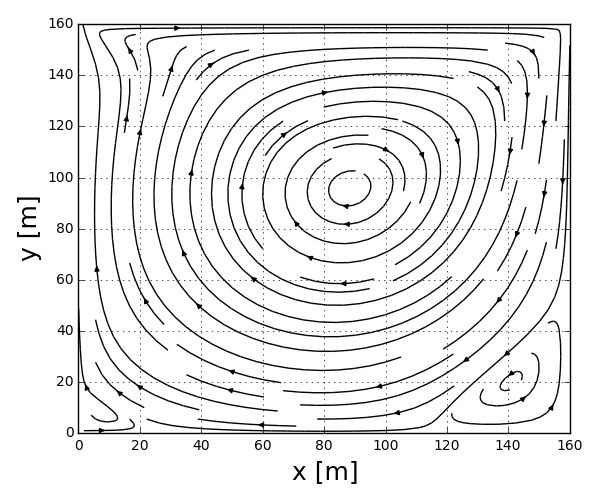
<Streamlines of 160x160 case runs>
<Centerline u-velocity>
<Centerline v-velocity>
- Observation
- As compared to previous condition of Re=100, the higher Reynolds number lid moving speed makes more strong vorticity on the bottom corner.
- The centered vortext relocates its position further down and so it moveds toward the center of domain.